dotnetcharting 是一个很好用的图表控件,能画出很漂亮的报表,一般常用到的主要有
柱状图、饼图、折线图三种。
dotnetcharting 有web版、winform版多个
版本可供使用,官方网址:http://www.dotnetcharting.com/ ,官网有很多示例(http://www.dotnetcharting.com/gallery/),而且有winform安装版示例和代码,如下图。
dotnetcharting 有网上破解版的,去博客园或谷歌一搜一堆。
说下个人感受,该控件是国外开发的,虽然说这个控件挺好用的,但是感觉这个控件应该在有xp系统的时候就应该有了吧?是国外剩下的技术,咱们一直在
用别人不用的技术,捧为珍宝。
有些技术有些人,有些
本事就开始自大起来,小有成就的那点技术还藏着掖着。
呵呵。。。
 接下来上干货,前两天刚使用dotnetcharting 做了个统计报表,代码如下:
using System;
using System.Collections.Generic;
using System.Data;
using System.Drawing;
using dotnetCHARTING.WinForms;
using StationChart.Model;
using StationChart.Utility;
using Chart = dotnetCHARTING.WinForms.Chart;
using Series = dotnetCHARTING.WinForms.Series;
using SeriesCollection = dotnetCHARTING.WinForms.SeriesCollection;
namespace ManageSystem
{
// <summary>
// 作者:薛江涛
// 版本:V1.0.0
// 时间:2014/10/9 11:49:48
// </summary>
public
class ShowData
{
#region 属性
private string _phaysicalimagepath;//图片存放路径
private string _xtitle;//图片x座标名称
private string _ytitle;//图片y座标名称
private string _seriesname;//图例名称
private int _picwidth;//图片宽度
private int _pichight;//图片高度
private DataTable _dt;//图片数据源
private
DataSet _ds;//图片数据源
private Color _titleBoxColor;//图片标题背景色
private Font _titleBoxFont;//图片标题字体
private Color _chartAreaBackgroundColor;//图片背景颜色
private Font _xAxisLabelFont;//X轴柱状图值字体
private Font _yAxisLabelFont;//Y轴柱状图值字体
private Font _xAxis
DefaultTickLabelFont;//X轴刻度字体
private Font _yAxisDefaultTickLabelFont;//Y轴刻度字体
private SeriesType _chartDefaultSeriesType;//图片类型
private ChartType _chartType;//图片类型
//private bool _isMonth; //是否是月显示
private int _staticColumnWidth;//设置柱状图每个单元格的宽度
private int _numberPercision;//设置数值小数点
/// <summary>
/// 图片存放路径
/// </summary>
public string PhaysicalImagePath
{
set { _phaysicalimagepath = value; }
get { return _phaysicalimagepath; }
}
/// <summary>
/// 图片标题
/// </summary>
public string Title { get; set; }
/// <summary>
/// 图片标题
/// </summary>
public string XTitle
{
set { _xtitle = value; }
get { return _xtitle; }
}
/// <summary>
/// 图片标题
/// </summary>
public string YTitle
{
set { _ytitle = value; }
get { return _ytitle; }
}
/// <summary>
/// 图例名称
/// </summary>
public string SeriesName
{
set { _seriesname = value; }
get { return _seriesname; }
}
/// <summary>
/// 图片宽度
/// </summary>
public int PicWidth
{
set { _picwidth = value; }
get { return _picwidth; }
}
/// <summary>
/// 图片高度
/// </summary>
public int PicHight
{
set { _pichight = value; }
get { return _pichight; }
}
/// <summary>
/// 图片数据源
/// </summary>
public DataTable DataSource
{
set { _dt = value; }
get { return _dt; }
}
/// <summary>
/// 图片数据源
/// </summary>
public DataSet DataSetSource
{
set { _ds = value; }
get { return _ds; }
}
public int NumberPercision
{
set { _numberPercision = value; }
get { return _numberPercision; }
}
public Color TitleBoxColor
{
get { return _titleBoxColor; }
set { _titleBoxColor = value; }
}
public Font TitleBoxFont
{
get { return _titleBoxFont; }
set { _titleBoxFont = value; }
}
public Color ChartAreaBackgroundColor
{
get { return _chartAreaBackgroundColor; }
set { _chartAreaBackgroundColor = value; }
}
public Font XAxisLabelFont
{
get { return _xAxisLabelFont; }
set { _xAxisLabelFont = value; }
}
public Font YAxisLabelFont
{
get { return _yAxisLabelFont; }
set { _yAxisLabelFont = value; }
}
public Font XAxisDefaultTickLabelFont
{
get { return _xAxisDefaultTickLabelFont; }
set { _xAxisDefaultTickLabelFont = value; }
}
public Font YAxisDefaultTickLabelFont
{
get { return _yAxisDefaultTickLabelFont; }
set { _yAxisDefaultTickLabelFont = value; }
}
public SeriesType ChartDefaultSeriesType
{
get { return _chartDefaultSeriesType; }
set { _chartDefaultSeriesType = value; }
}
public ChartType ChartType
{
get { return _chartType; }
set { _chartType = value; }
}
//public bool IsMonth
//{
// get { return _isMonth; }
// set { _isMonth = value; }
//}
public ModelConseme.DateChartEnum SeriesTypeE { get; set; }
public int StaticColumnWidth
{
get { return _staticColumnWidth; }
set { _staticColumnWidth = value; }
}
#endregion
#region
构造函数
public ShowData()
{
//
// TODO: 在此处添加构造函数逻辑
//
NumberPercision = 2;
}
public ShowData(string phaysicalImagePath, string title, string xTitle, string yTitle, string seriesName)
{
_phaysicalimagepath = phaysicalImagePath;
Title = title;
_xtitle = xTitle;
_ytitle = yTitle;
_seriesname = seriesName;
}
#endregion
private static readonly object ThisLock = new object();
#region 输出柱形图
/// <summary>
/// 柱形图
/// </summary>
/// <returns></returns>
public void CreateColumn(Chart chart)
{
try
{
//清空图片
chart.SeriesCollection.Clear();
//标题框设置
//标题的颜色
chart.TitleBox.Label.Color = _titleBoxColor;
//标题字体设置
chart.TitleBox.Label.Font = _titleBoxFont;
//控制柱状图颜色
chart.ShadingEffectMode = ShadingEffectMode.One;
chart.TitleBox.Position = TitleBoxPosition.None;
//图表背景颜色
chart.ChartArea.Background.Color = ChartAreaBackgroundColor;
//1.图表类型
chart.DefaultSeries.Type = _chartDefaultSeriesType;// SeriesType.Column;
//chart.DefaultSeries.Type = SeriesType.Cylinder;
//2.图表类型
//柱状图
//chart.Type = ChartType.TreeMap;
////横向柱状图
chart.Type = _chartType;// ChartType.ComboHorizontal
////横向柱状图
//chart.Type =_chartType;// ChartType.Gantt;
////饼状图
//chart.Type = ChartType.Pies;
//y轴图表阴影颜色
//chart.YAxis.AlternateGridBackground.Color = Color.FromArgb(255, 250, 250, 250);
chart.LegendBox.HeaderLabel = new Label("图表说明", new Font("Microsoft Sans Serif", 10F, FontStyle.Bold, GraphicsUnit.Point, 134));
//chart.LegendBox.HeaderLabel.Font = new Font("Microsoft Sans Serif", 16F, System.Drawing.FontStyle.Bold, System.Drawing.GraphicsUnit.Point, 134);
chart.LegendBox.Label.Font = new Font("Microsoft Sans Serif", 9F, FontStyle.Bold, GraphicsUnit.Point, 134);
chart.Palette = new Color[] { Color.FromArgb(0, 156, 255), Color.FromArgb(255, 99, 49), Color.FromArgb(49, 255, 49), Color.FromArgb(255, 255, 0), };
chart.Title = Title;
//X轴柱状图值字体
chart.XAxis.Label.Text = _xtitle;
chart.XAxis.Label.Font = _xAxisLabelFont;
//设置X轴刻度值说明字体
chart.XAxis.DefaultTick.Label.Font = _xAxisDefaultTickLabelFont;
chart.XAxis.StaticColumnWidth = _staticColumnWidth; //每个单元格的宽度
//Y轴柱状图值字体
chart.YAxis.Label.Text = _ytitle;
chart.YAxis.Label.Font = _yAxisLabelFont;
//设置Y轴刻度值说明字体
chart.YAxis.DefaultTick.Label.Font = _yAxisDefaultTickLabelFont;
//Y轴箭头标示
chart.XAxis.Name = XTitle;
if (_chartType == ChartType.ComboHorizontal)
{
chart.XAxis.TickLabelPadding = 10;
chart.XAxis.Line.StartCap = System.Drawing.Drawing2D.LineCap.Square;
chart.XAxis.Line.EndCap = System.Drawing.Drawing2D.LineCap.ArrowAnchor;
chart.XAxis.Line.Width = 5;//箭头宽度
chart.XAxis.Line.Color = Color.Gray;
}
else
{
chart.YAxis.TickLabelPadding = 10;
chart.YAxis.Line.StartCap = System.Drawing.Drawing2D.LineCap.Square;
chart.YAxis.Line.EndCap = System.Drawing.Drawing2D.LineCap.ArrowAnchor;
chart.YAxis.Line.Width = 5;//箭头宽度
chart.YAxis.Line.Color = Color.Gray;
//显示值格式化(小数点显示几位)
chart.YAxis.NumberPercision = _numberPercision;
}
//图片存放路径
chart.TempDirectory = System.Environment.CurrentDirectory + "\\" + _phaysicalimagepath;
//图表宽度
chart.Width = _picwidth;
//图表高度
chart.Height = _pichight;
chart.Series.Name = _seriesname;
//单一图形
//chart.Series.Data = _dt;
//chart.SeriesCollection.Add();
//图例在标题行显示,但是没有合计信息
//chart.TitleBox.Position = TitleBoxPosition.FullWithLegend;
//chart.TitleBox.Label.Alignment = StringAlignment.Center;
//chart.LegendBox.Position = LegendBoxPosition.None; //不显示图例,指不在右侧显示,对上面一行的
属性设置并没有影响
chart.DefaultSeries.DefaultElement.ShowValue = true;
chart.ShadingEffect = true;
chart.Use3D = false;
chart.Series.DefaultElement.ShowValue = true;
chart.SeriesCollection.Add(GetArrayData());
}
catch (Exception ex)
{
LogHelper.WriteErrorLog(ex.ToString(), ex);
}
}
/// <summary>
/// 柱形图
/// </summary>
/// <returns></returns>
public void CreateColumn(Chart chart, List<int> list)
{
try
{
chart.SeriesCollection.Clear();
//标题框设置
//标题的颜色
chart.TitleBox.Label.Color = _titleBoxColor;
//标题字体设置
chart.TitleBox.Label.Font = _titleBoxFont;
//控制柱状图颜色
chart.ShadingEffectMode = ShadingEffectMode.Five;
//图表背景颜色
chart.ChartArea.Background.Color = ChartAreaBackgroundColor;
//1.图表类型
chart.DefaultSeries.Type = _chartDefaultSeriesType;// SeriesType.Column;
//chart.DefaultSeries.Type = SeriesType.Cylinder;
//2.图表类型
//柱状图
//chart.Type = ChartType.TreeMap;
////横向柱状图
chart.Type = _chartType;// ChartType.ComboHorizontal
////横向柱状图
//chart.Type =_chartType;// ChartType.Gantt;
////饼状图
//chart.Type = ChartType.Pies;
//y轴图表阴影颜色
//chart.YAxis.AlternateGridBackground.Color = Color.FromArgb(255, 250, 250, 250);
chart.LegendBox.HeaderLabel = new Label("图表说明", new Font("Microsoft Sans Serif", 10F, FontStyle.Bold, GraphicsUnit.Point, 134));
//chart.LegendBox.HeaderLabel.Font = new Font("Microsoft Sans Serif", 16F, System.Drawing.FontStyle.Bold, System.Drawing.GraphicsUnit.Point, 134);
chart.LegendBox.Label.Font = new Font("Microsoft Sans Serif", 9F, FontStyle.Bold, GraphicsUnit.Point, 134);
chart.Palette = new Color[] { Color.FromArgb(0, 156, 255), Color.FromArgb(255, 99, 49), Color.FromArgb(49, 255, 49), Color.FromArgb(255, 255, 0), };
chart.Title = Title;
//X轴柱状图值字体
chart.XAxis.Label.Text = _xtitle;
chart.XAxis.Label.Font = _xAxisLabelFont;
//设置X轴刻度值说明字体
chart.XAxis.DefaultTick.Label.Font = _xAxisDefaultTickLabelFont;
chart.XAxis.StaticColumnWidth = _staticColumnWidth; //每个单元格的宽度
//Y轴柱状图值字体
chart.YAxis.Label.Text = _ytitle;
chart.YAxis.Label.Font = _yAxisLabelFont;
//设置Y轴刻度值说明字体
chart.YAxis.DefaultTick.Label.Font = _yAxisDefaultTickLabelFont;
//Y轴箭头标示
chart.XAxis.Name = XTitle;
if (_chartType == dotnetCHARTING.WinForms.ChartType.ComboHorizontal)
{
chart.XAxis.TickLabelPadding = 10;
chart.XAxis.Line.StartCap = System.Drawing.Drawing2D.LineCap.Square;
chart.XAxis.Line.EndCap = System.Drawing.Drawing2D.LineCap.ArrowAnchor;
chart.XAxis.Line.Width = 5;//箭头宽度
chart.XAxis.Line.Color = Color.Gray;
}
else
{
chart.YAxis.TickLabelPadding = 10;
chart.YAxis.Line.StartCap = System.Drawing.Drawing2D.LineCap.Square;
chart.YAxis.Line.EndCap = System.Drawing.Drawing2D.LineCap.ArrowAnchor;
chart.YAxis.Line.Width = 5;//箭头宽度
chart.YAxis.Line.Color = Color.Gray;
//显示值格式化(小数点显示几位)
chart.YAxis.NumberPercision = _numberPercision;
}
//图片存放路径
chart.TempDirectory = System.Environment.CurrentDirectory + "\\" + _phaysicalimagepath;
//图表宽度
chart.Width = _picwidth;
//图表高度
chart.Height = _pichight;
chart.Series.Name = _seriesname;
//单一图形
//chart.Series.Data = _dt;
//chart.SeriesCollection.Add();
//图例在标题行显示,但是没有合计信息
//chart.TitleBox.Position = TitleBoxPosition.FullWithLegend;
//chart.TitleBox.Label.Alignment = StringAlignment.Center;
//chart.LegendBox.Position = LegendBoxPosition.None; //不显示图例,指不在右侧显示,对上面一行的属性设置并没有影响
chart.DefaultSeries.DefaultElement.ShowValue = true;
chart.ShadingEffect = true;
chart.Use3D = false;
chart.Series.DefaultElement.ShowValue = true;
chart.SeriesCollection.Add(GetArrayData(list));
}
catch (Exception ex)
{
LogHelper.WriteErrorLog(ex.ToString(), ex);
}
}
///// <summary>
///// 柱形图,单一图片
///// </summary>
///// <returns></returns>
//public void CreateColumn(Chart chart1)
//{
// Chart1.Title = _title;
// Chart1.XAxis.Label.Text = _xtitle;
// Chart1.YAxis.Label.Text = _ytitle;
// Chart1.TempDirectory = PhaysicalImagePath;
// Chart1.Width = _picwidth;
// Chart1.Height = _pichight;
// Chart1.Type = ChartType.Combo;
// Chart1.Series.Type = SeriesType.Cylinder;
// Chart1.Series.Name = _seriesname;
// Chart1.Series.Data = _dt;
// Chart1.SeriesCollection.Add();
// Chart1.DefaultSeries.DefaultElement.ShowValue = true;
// Chart1.ShadingEffect = true;
// Chart1.Use3D = false;
// Chart1.Series.DefaultElement.ShowValue = true;
//}
#endregion
#region 输出饼图
/// <summary>
/// 饼图
/// </summary>
/// <returns></returns>
public void CreatePie(Chart chart)
{
try
{
chart.SeriesCollection.Clear();
//控制饼图颜色
chart.ShadingEffectMode = ShadingEffectMode.Two;
chart.TitleBox.Position = TitleBoxPosition.None;
chart.Title = Title;
//标题的颜色
chart.TitleBox.Label.Color = _titleBoxColor;
//标题字体设置
chart.TitleBox.Label.Font = _titleBoxFont;
//图表说明
chart.LegendBox.HeaderLabel = new dotnetCHARTING.WinForms.Label("图表说明", new Font("Microsoft Sans Serif", 10F, System.Drawing.FontStyle.Bold, System.Drawing.GraphicsUnit.Point, 134));
//chart.LegendBox.HeaderLabel.Font = new Font("Microsoft Sans Serif", 16F, System.Drawing.FontStyle.Bold, System.Drawing.GraphicsUnit.Point, 134);
chart.LegendBox.Label.Font = new Font("Microsoft Sans Serif", 9F, System.Drawing.FontStyle.Bold, System.Drawing.GraphicsUnit.Point, 134);
chart.Palette = new Color[] { Color.FromArgb(0, 156, 255), Color.FromArgb(255, 99, 49), Color.FromArgb(49, 255, 49), Color.FromArgb(255, 255, 0), };
chart.Title = Title;
//X轴柱状图值字体
chart.XAxis.Label.Text = _xtitle;
chart.XAxis.Label.Font = _xAxisLabelFont;
//设置X轴刻度值说明字体
chart.XAxis.DefaultTick.Label.Font = _xAxisDefaultTickLabelFont;
chart.XAxis.Label.Text = _xtitle;
chart.YAxis.Label.Text = _ytitle;
chart.TempDirectory = _phaysicalimagepath;
chart.Width = _picwidth;
chart.Height = _pichight;
chart.Type = ChartType.Pie;
chart.Series.Type = SeriesType.Cylinder;
chart.Series.Name = _seriesname;
chart.YAxis.NumberPercision = _numberPercision;
chart.ShadingEffect = true;
chart.Use3D = false;
chart.DefaultSeries.DefaultElement.Transparency = 20;//线条透明度
chart.DefaultSeries.DefaultElement.ShowValue = true;
chart.PieLabelMode = dotnetCHARTING.WinForms.PieLabelMode.Outside;
chart.SeriesCollection.Add(GetPieArrayData());
chart.Series.DefaultElement.ShowValue = true;
}
catch (Exception ex)
{
LogHelper.WriteErrorLog(ex.ToString(), ex);
}
}
#region 输出曲线图
/// <summary>
/// 曲线图,昨日今日对比
/// </summary>
/// <returns></returns>
public void CreateLine(Chart chart)
{
try
{
chart.SeriesCollection.Clear();
chart.TitleBox.Position = TitleBoxPosition.None;
//标题的颜色
chart.TitleBox.Label.Color = _titleBoxColor;
//标题字体设置
chart.TitleBox.Label.Font = _titleBoxFont;
//图表背景颜色
chart.ChartArea.Background.Color = ChartAreaBackgroundColor;
//X轴柱状图值字体
chart.XAxis.Label.Font = _xAxisLabelFont;
//设置X轴刻度值说明字体
chart.XAxis.DefaultTick.Label.Font = _xAxisDefaultTickLabelFont;
//Y轴柱状图值字体
chart.YAxis.Label.Font = _yAxisLabelFont;
//设置Y轴刻度值说明字体
chart.YAxis.DefaultTick.Label.Font = _yAxisDefaultTickLabelFont;
//Y轴箭头标示
chart.YAxis.TickLabelPadding = 0;
chart.YAxis.Line.StartCap = System.Drawing.Drawing2D.LineCap.Square;
chart.YAxis.Line.EndCap = System.Drawing.Drawing2D.LineCap.ArrowAnchor;
chart.YAxis.Line.Width = 5;//箭头宽度
chart.YAxis.Line.Color = Color.Gray;
chart.Title = Title;
chart.XAxis.Label.Text = _xtitle;
chart.YAxis.Label.Text = _ytitle;
chart.TempDirectory = _phaysicalimagepath;
// Set the size
chart.Width = _picwidth;
chart.Height = _pichight;
// Set the temp directory
chart.TempDirectory = "temp";
// Debug mode. ( Will show generated errors if any )
chart.Debug = true;
chart.Type = ChartType.Combo;
chart.DefaultSeries.Type = SeriesType.Line;
//chart.Series.Type = SeriesType.Line;
chart.Series.Name = _seriesname;
chart.DefaultSeries.DefaultElement.ShowValue = false;
chart.ShadingEffect = true;
chart.Use3D = false;
chart.Series.DefaultElement.ShowValue = true;
chart.DefaultSeries.DefaultElement.Transparency = 20;//线条透明度
chart.DateGrouping = TimeInterval.Day;
////显示值格式化(小数点显示几位)
chart.YAxis.NumberPercision = _numberPercision;
chart.OverlapFooter = false;
SeriesCollection mySC = GetRandomData();
mySC[0].DefaultElement.Color = Color.FromArgb(255, 99, 49);
mySC[1].DefaultElement.Color = Color.FromArgb(0, 156, 255);
// Add the random data.
chart.SeriesCollection.Add(mySC);
}
catch (Exception ex)
{
LogHelper.WriteErrorLog(ex.ToString(), ex);
}
}
#endregion
/// <summary>
/// 曲线图
/// </summary>
/// <returns></returns>
SeriesCollection GetRandomData()
{
SeriesCollection sc = new SeriesCollection();
try
{
DataTable dt = _dt;
var s = new Series();
var s2 = new Series();
switch (SeriesTypeE)
{
case ModelConseme.DateChartEnum.DayChart:
for (int i = 0; i < 24; i++)
{
s.Name = "今天";
s2.Name = "昨天";
Element e = new Element();
// 每元素的名称
e.Name = (i).ToString();
// 每元素的大小数值
e.YValue = 0;
Element e2 = new Element();
// 每元素的名称
e2.Name = (i).ToString();
// 每元素的大小数值
e2.YValue = 0;
s.Elements.Add(e);
s2.Elements.Add(e2);
sc.Add(s);
sc.Add(s2);
}
for (int i = 0; i < dt.Rows.Count; i++)
{
string sodayHH = dt.Rows[i][1].ToString();
string today = dt.Rows[i][1].ToString().Substring(0, 10);
int HH = Convert.ToInt32(sodayHH.Substring(11));
if (DateTime.Now.ToString("yyyy-MM-dd").Equals(today))
{
sc[0].Elements[HH].YValue = Convert.ToDouble(dt.Rows[i][2].ToString());
}
else
{
sc[1].Elements[HH].YValue = Convert.ToDouble(dt.Rows[i][2].ToString());
}
}
break;
case ModelConseme.DateChartEnum.MonthChart:
for (int i = 1; i < 32; i++)
{
s.Name = "本月";
s2.Name = "上月";
var e = new Element();
// 每元素的名称
e.Name = (i).ToString();
// 每元素的大小数值
e.YValue = 0;
var e2 = new Element();
// 每元素的名称
e2.Name = (i).ToString();
// 每元素的大小数值
e2.YValue = 0;
s.Elements.Add(e);
s2.Elements.Add(e2);
sc.Add(s);
sc.Add(s2);
}
for (int i = 0; i < dt.Rows.Count; i++)
{
string sodayHH = dt.Rows[i][1].ToString();
string month = dt.Rows[i][1].ToString().Substring(0, 7);
int ovaule = Convert.ToInt32(sodayHH.Substring(8));
if (DateTime.Now.ToString("yyyy-MM").Equals(month))
{
sc[0].Elements[ovaule - 1].YValue = Convert.ToDouble(dt.Rows[i][2].ToString());
}
else
{
sc[1].Elements[ovaule - 1].YValue = Convert.ToDouble(dt.Rows[i][2].ToString());
}
}
break;
case ModelConseme.DateChartEnum.YearChart:
for (int i = 1; i < 13; i++)
{
s.Name = "本年";
s2.Name = "去年";
Element e = new Element();
// 每元素的名称
e.Name = (i).ToString();
// 每元素的大小数值
e.YValue = 0;
Element e2 = new Element();
// 每元素的名称
e2.Name = (i).ToString();
// 每元素的大小数值
e2.YValue = 0;
s.Elements.Add(e);
s2.Elements.Add(e2);
sc.Add(s);
sc.Add(s2);
}
for (int i = 0; i < dt.Rows.Count; i++)
{
string sodayHH = dt.Rows[i][1].ToString();
string year = dt.Rows[i][1].ToString().Substring(0, 4);
int ovaule = sodayHH.Contains("-") ? Convert.ToInt32(sodayHH.Substring(5)) : Convert.ToInt32(sodayHH.Substring(4));
if (DateTime.Now.ToString("yyyy").Equals(year))
{
sc[0].Elements[ovaule - 1].YValue = Convert.ToDouble(dt.Rows[i][2].ToString());
}
else
{
sc[1].Elements[ovaule - 1].YValue = Convert.ToDouble(dt.Rows[i][2].ToString());
}
}
break;
}
//SC[0].PaletteName = Palette.None;//.Color = Color.FromArgb(49,255,49);
return sc;
}
catch (Exception ex)
{
LogHelper.WriteErrorLog(ex.ToString(), ex);
return sc;
}
}
/// <summary>
/// 饼图
/// </summary>
/// <returns></returns>
private SeriesCollection GetPieArrayData()
{
SeriesCollection sc = new SeriesCollection();
try
{
DataTable dt = _dt;
for (int i = 0; i < dt.Rows.Count; i++)
{
Series s = new Series();
s.Name = dt.Rows[i][1].ToString();
Element e = new Element();
// 每元素的名称
e.Name = dt.Rows[i][1].ToString();
//设置柱状图值的字体
e.SmartLabel.Font = new System.Drawing.Font("Microsoft Sans Serif", 10F, System.Drawing.FontStyle.Bold, System.Drawing.GraphicsUnit.Point, 134);
//e.SmartLabel.DynamicDisplay = true;
//e.SmartLabel.AutoWrap = true;
// 每元素的大小数值
e.YValue = Convert.ToDouble(dt.Rows[i][2].ToString());
//s.PaletteName = Palette.
Three;
//s.DefaultElement.Color = Color.FromArgb(49, 255, 49);
s.Elements.Add(e);
sc.Add(s);
}
//SC[0].PaletteName = Palette.Poppies;//.Color = Color.FromArgb(49,255,49);
//SC[0].DefaultElement.Color = Color.FromArgb(49, 255, 49);
//SC[0].DefaultElement.Color = Color.FromArgb(49, 255, 49);
//SC[1].DefaultElement.Color = Color.FromArgb(255, 255, 0);
//SC[2].DefaultElement.Color = Color.FromArgb(255, 99, 49);
//SC[3].DefaultElement.Color = Color.FromArgb(0, 156, 255);
return sc;
}
catch (Exception ex)
{
LogHelper.WriteErrorLog(ex.ToString(), ex);
return sc;
}
}
/// <summary>
/// 柱状图
/// </summary>
/// <returns></returns>
private SeriesCollection GetArrayData()
{
SeriesCollection sc = new SeriesCollection();
try
{
DataTable dt = _dt;
Series s = new Series();
for (int i = 0; i < dt.Rows.Count; i++)
{
s.Name = dt.Rows[i][1].ToString();
if (s.Name == "")
continue;
var e = new Element();
// 每元素的名称
e.Name = dt.Rows[i][1].ToString();
//设置柱状图值的字体
e.SmartLabel.Font = new System.Drawing.Font("Microsoft Sans Serif", 10F, System.Drawing.FontStyle.Bold, System.Drawing.GraphicsUnit.Point, 134);
//e.SmartLabel.DynamicDisplay = true;
//e.SmartLabel.AutoWrap = true;
// 每元素的大小数值
e.YValue = Convert.ToDouble(dt.Rows[i][2].ToString());
//调整柱子颜色
//s.PaletteName = Palette.Three;
s.Palette = new Color[] { Color.FromArgb(0, 156, 255), Color.FromArgb(255, 99, 49), Color.FromArgb(49, 255, 49), Color.FromArgb(255, 255, 0), };
s.Elements.Add(e);
}
sc.Add(s);
return sc;
}
catch (Exception ex)
{
LogHelper.WriteErrorLog(ex.ToString(), ex);
return sc;
}
}
/// <summary>
/// 柱状图
/// </summary>
/// <returns></returns>
private SeriesCollection GetArrayData(List<int> list)
{
SeriesCollection sc = new SeriesCollection();
try
{
DataTable dt = _ds.Tables[list[0]];
DataTable dt2 = _ds.Tables[list[1]];
Dictionary<string, string> oilDicT = new Dictionary<string, string>();
Dictionary<string, string> oilDicY = new Dictionary<string, string>();
for (int i = 0; i < dt.Rows.Count; i++)
{
oilDicT.Add(dt.Rows[i][1].ToString(), dt.Rows[i][2].ToString());
}
for (int i = 0; i < dt2.Rows.Count; i++)
{
oilDicY.Add(dt2.Rows[i][1].ToString(), dt2.Rows[i][2].ToString());
}
foreach (KeyValuePair<string, string> keyValue in oilDicT)
{
if (!oilDicY.ContainsKey(keyValue.Key))
{
oilDicY.Add(keyValue.Key, "0");
}
}
foreach (KeyValuePair<string, string> keyValue in oilDicY)
{
if (!oilDicT.ContainsKey(keyValue.Key))
{
oilDicT.Add(keyValue.Key, "0");
}
}
var oiList = new List<Dictionary<string, string>> { oilDicT, oilDicY };
for (int a = 0; a < oiList.Count; a++)
{
var dicN = oiList[a];
Series s = new Series();
switch (SeriesTypeE)
{
case ModelConseme.DateChartEnum.DayChart:
s.Name = a == 0 ? "今天" : "昨天";
break;
case ModelConseme.DateChartEnum.MonthChart:
s.Name = a == 0 ? "本月" : "上月";
break;
case ModelConseme.DateChartEnum.YearChart:
s.Name = a == 0 ? "今年" : "去年";
break;
}
foreach (KeyValuePair<string, string> keyValue in dicN)
{
Element e = new Element();
// 每元素的名称
e.Name = keyValue.Key;
//设置柱状图值的字体
e.SmartLabel.Font = new System.Drawing.Font("Microsoft Sans Serif", 10F,
System.Drawing.FontStyle.Bold, System.Drawing.GraphicsUnit.Point, 134);
//e.SmartLabel.DynamicDisplay = true;
//e.SmartLabel.AutoWrap = true;
// 每元素的大小数值
e.YValue = Convert.ToDouble(keyValue.Value);
//s.PaletteName = Palette.Poppies;
//s.DefaultElement.Color = Color.FromArgb(49, 255, 49);
s.Elements.Add(e);
}
sc.Add(s);
}
return sc;
}
catch (Exception ex)
{
LogHelper.WriteErrorLog(ex.ToString(), ex);
return sc;
}
}
/// <summary>
/// 柱状图2
/// </summary>
/// <returns></returns>
private SeriesCollection GetArrayData2()
{
SeriesCollection sc = new SeriesCollection();
try
{
DataTable dt = _dt;
for (int a = 0; a < 2; a++)
{
Series s = new Series();
s.Name = (a == 0 ? "今天" : "昨天");
for (int i = 0; i < dt.Rows.Count; i++)
{
Element e = new Element();
// 每元素的名称
e.Name = dt.Rows[i][1].ToString();
//设置柱状图值的字体
e.SmartLabel.Font = new System.Drawing.Font("Microsoft Sans Serif", 10F, System.Drawing.FontStyle.Bold, System.Drawing.GraphicsUnit.Point, 134);
//e.SmartLabel.DynamicDisplay = true;
//e.SmartLabel.AutoWrap = true;
// 每元素的大小数值
e.YValue = Convert.ToDouble(dt.Rows[i][2].ToString());
s.PaletteName = Palette.Poppies;
//s.DefaultElement.Color = Color.FromArgb(49, 255, 49);
s.Elements.Add(e);
}
sc.Add(s);
}
return sc;
}
catch (Exception ex)
{
LogHelper.WriteErrorLog(ex.ToString(), ex);
return sc;
}
}
#endregion
}
}
调用方法:
ShowData show = new ShowData();
//show.PicHight = 494;
//show.PicWidth = 1336;
show.SeriesName = "具体详情";
show.PhaysicalImagePath = "ChartImages";
show.TitleBoxColor = Color.Blue;
show.TitleBoxFont = new Font("Arial", 10, FontStyle.Bold);
show.ChartAreaBackgroundColor = Color.Honeydew;
show.XAxisLabelFont = new System.Drawing.Font("Microsoft Sans Serif", 10F, System.Drawing.FontStyle.Bold, System.Drawing.GraphicsUnit.Point, ((byte)(134)));
show.YAxisLabelFont = new System.Drawing.Font("Microsoft Sans Serif", 10F, System.Drawing.FontStyle.Bold, System.Drawing.GraphicsUnit.Point, ((byte)(134)));
show.XAxisDefaultTickLabelFont = new System.Drawing.Font("Microsoft Sans Serif", 10F, System.Drawing.FontStyle.Bold, System.Drawing.GraphicsUnit.Point, ((byte)(134)));
show.YAxisDefaultTickLabelFont = new System.Drawing.Font("Microsoft Sans Serif", 10F, System.Drawing.FontStyle.Bold, System.Drawing.GraphicsUnit.Point, ((byte)(134)));
show.ChartDefaultSeriesType = SeriesType.Column;
show.DataSetSource = dsSet;
show.SeriesTypeE = modelConseme.DateChart;
//饼图
show.YTitle = "油量(升)";
//show.Title = strOils + strDate + strConsume + "销售油量报表统计图";
show.XTitle = "";
show.DataSource = dsSet.Tables[0];
show.CreatePie(this.chart1);
//柱状图(两条柱子对比)
show.YTitle = "油量(升)";
label2.Text = strDate + strOils + strConsume + @"油品对比图";
show.XTitle = "油品";
//show.DataSource = dsSet.Tables[2];
show.StaticColumnWidth = 0;
show.CreateColumn(chart2, new List<int>()
{
0,
1
});
//曲线图
show.YTitle = "油量(升)";
label5.Text = strDate + strOils + strConsume + @"油量环比图";
show.XTitle = "时间";
show.DataSource = dsSet.Tables[4];
show.CreateLine(this.chart5);
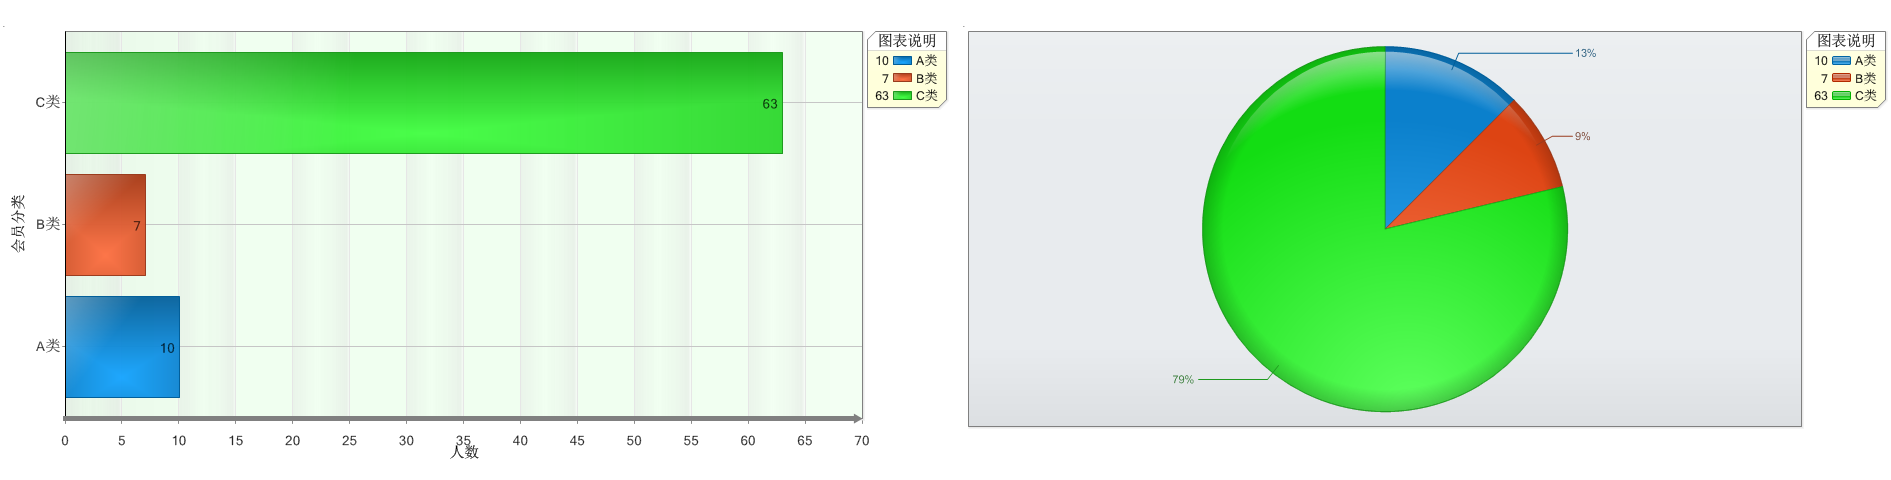
//单个柱子
var show = new ShowData
{
Title = "近30天加油会员统计",
XTitle = "人数",
YTitle = "会员分类",
SeriesName = "具体详情",
PhaysicalImagePath = "ChartImages",
DataSource = dsSet.Tables[0],
TitleBoxColor = Color.Blue,
TitleBoxFont = new Font("Arial", 10, FontStyle.Bold),
ChartAreaBackgroundColor = Color.Honeydew,
XAxisLabelFont = new Font("Microsoft Sans Serif", 10F, FontStyle.Bold, GraphicsUnit.Point, 134),
YAxisLabelFont = new Font("Microsoft Sans Serif", 10F, FontStyle.Bold, GraphicsUnit.Point, 134),
XAxisDefaultTickLabelFont =
new Font("Microsoft Sans Serif", 10F, FontStyle.Bold, GraphicsUnit.Point, 134),
YAxisDefaultTickLabelFont =
new Font("Microsoft Sans Serif", 10F, FontStyle.Bold, GraphicsUnit.Point, 134),
ChartDefaultSeriesType = SeriesType.Column,
ChartType = ChartType.ComboHorizontal,
StaticColumnWidth = 80
};
show.CreateColumn(chart1);
show.NumberPercision = 0;
show.CreatePie(chart2);
效果图如下: