php.ini
class="java" name="code">
zend_extension_ts = "c:\wamp\php\ext\php_xdebug-2.0.2-5.2.5.dll"
xdebug.auto_trace = On
xdebug.collect_params = On
xdebug.collect_return = On
xdebug.trace_output_dir = "d:/debuginfo"
xdebug.profiler_enable = On
xdebug.profiler_output_dir = "d:/debuginfo"
xdebug.remote_enable = true
xdebug.remote_mode = req
xdebug.remote_host = 127.0.0.1
xdebug.remote_port = 19000
xdebug.remote_handler = dbgp

;是否覆盖php里面的函数var_dump();默认是开启的,值为1;设为0,则关闭;
xdebug.overload_var_dump = 1

;WinCacheGrind使用
xdebug.profiler_output_name = "cachegrind.out.%p"
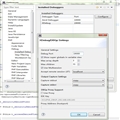
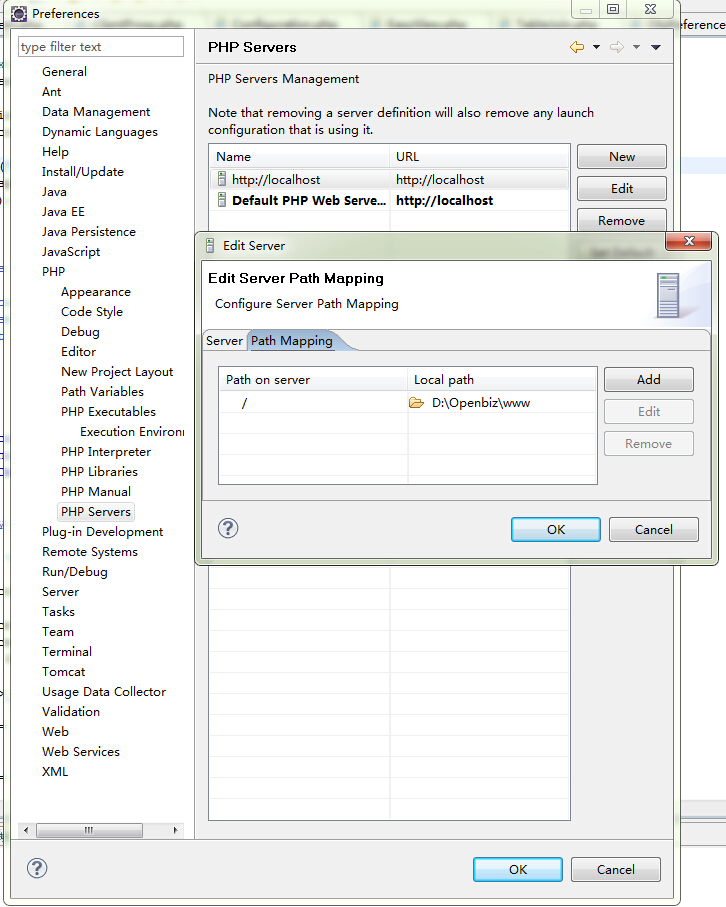
eclipse 配置


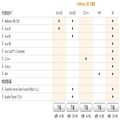
WinCacheGrind是
windows下的profile查看程序。 查看debug信息http://sourceforge.net/
projects/wincachegrind
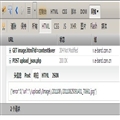
打开WinCacheGrind,将"Tools"=>"Options" =>"Main"的"working flolder" 设置为php.ini中指定的路径xdebug目录。然后刷新一下本地的网页,应该就可以看到下面的监控文件了。
使用 F5 F6 F8调试吧

- 大小: 130 KB

- 大小: 451.4 KB

- 大小: 415.7 KB

- 大小: 697.4 KB