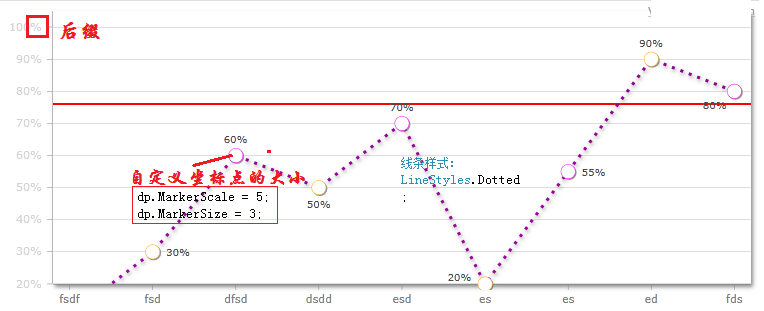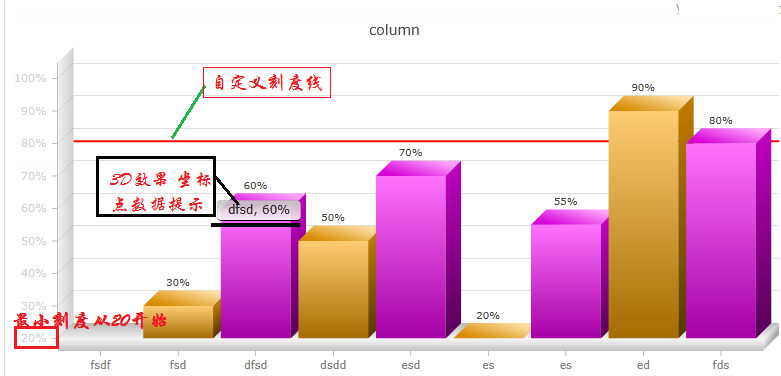

设置Chart的属
  //设置title的值
  // 创建一个标题的对象
  Title title = new Title();
  // 设置标题的名称
  title.Text = titleText;
  title.Padding = new Thickness(0, 10, 5, 0);
  // 向图标添加标题
  chart.Titles.Add(title);

  //是否显示3D效果
  chart.View3D = view3D;
  //图表数据过多滚动显示
  chart.ScrollingEnabled = isScroll;
  chart.Watermark = false;//去掉水印
  //设置绘制图表的形状 (枚举)
  ds.RenderAs = RenderAs.Column;
  // 设置绘制线条的样式
  ds.Linetyle = LineStyles.Dotted;
//图标描述
  ds.LegendText = legendText;
  ds.ShowInLegend = showLegend;
  //是否显示坐标点数据
  ds.LabelEnabled = showLabel;
设置坐标轴的属性
  #region 设置x抽信息
  AxisLabels xLabel = new AxisLabels();
  xLabel.FontColor = new SolidColorBrush(Colors.Gray); //x轴刻度文本信息颜色

  ChartGrid xGrid = new ChartGrid();//设置x轴的纵向刻度虚线
  xGrid.Enabled = false;

  Axis xAxis = new Axis();
  xAxis.Enabled = true; //是否显示X轴刻度、文本
  xAxis.AxisLabels = xLabel;
  xAxis.Grids.Add(xGrid);

  chart.AxesX.Add(xAxis);
  #endregion

  #region 设置y抽信息
  AxisLabels yLabel = new AxisLabels();
  yLabel.FontColor = new SolidColorBrush(Colors.LightGray); //y轴刻度文本信息颜色

  ChartGrid yGrid = new ChartGrid();// 设置y轴的横向刻度虚线
  yGrid.Enabled = true;

  Axis yAxis = new Axis();
  yAxis.Enabled = yAxisEnabeld; //是否显示Y轴刻度、文本
  yAxis.Grids.Add(yGrid);
  yAxis.AxisMinimum = minValue;  //y轴刻度最小值
  yAxis.AxisMaximum = maxValue;  //y轴刻度最大值
  yAxis.Prefix = pre; //"给刻度添加前缀";
  yAxis.Suffix = suf; //"给刻度添加后缀 如%";
  yAxis.Interval = 10;    //设置y轴刻度的增量 -- 即2个刻度值之间的的间隔
  yAxis.IntervalType = IntervalTypes.Number;
  yAxis.AxisLabels = yLabel;
  chart.AxesY.Add(yAxis);
  #endregion
设置坐标轴各数据的属性
 //设置坐标点的大小(线条图)
 dp.MarkerScale = 10;
 dp.MarkerSize = 5;

 //坐标点的颜色
 dp.Color = new SolidColorBrush(Colors.Red);
 //坐标点数值的颜色
 dp.LabelFontColor = new SolidColorBrush(Colors.Blue);
参考:http://www.cnblogs.com/forgetu/archive/2010/06/26/visifire-axis.html