This guide walks you through the?necessary?steps to configure the Eclipse IDE for PHP debugging. This can be very handy, especially when you��re trying to resolve an issue in a complex PHP application or plug-in.
Things you��ll need
- Eclipse
- Eclipse PHP Development Tools (PDT)
- Xdebug
Assumptions
This article assumes that you are configuring Eclipse and Xdebug for development on a localhost web server. If you are not, be sure to make appropriate adjustments to?accommodation?your needs. Likely the only changes you will need to make will be differences in connecting to your server verses localhost.
Quick Overview
For those that are unaware, Eclipse is a very popular IDE for developing in Java. However, Eclipse is much more powerful than that and can in fact easily be used for developing in many other languages including PHP.
Xdebug is a brilliant debugging extension designed for use with PHP. Once configured, Xdebug will allow you to remotely connect to your web server�� or in my case connect to my development localhost web server. Rather than using crude echo and logging techniques to debug your PHP code, Xdebug allows you to literally step through and inspect values and function flows in real-time.
If you��ve ever scratched your head at a PHP script and thrown in dozens of echos or logging statements to track the execution path then you��ll really come to appreciate the benefits of using Xdebug.
Configuring Eclipse and Xdebug isn��t difficult. In fact its painless with the correct steps on hand. That��s where this guide comes in. I found myself coming across incomplete or outdated forum posts and stackoverflow questions, so I thought I��d post what worked for me.
If you already have Java and Eclipse installed, then just jump ahead to installing and configuring the PHP Development Tools and Xdebug.
Install Eclipse
This will install ~118 new packages, assuming you��ve not already installed some of them, and will total around 255 MB that need to be downloaded.
- Open a terminal and enter the following command to install Eclipse:
sudo apt-get install eclipse
?
?
- After the download completes, open Eclipse to confirm that it installed correctly. Leave it open for our next install.
?
Install PHP Development Tools (PDT)
- If you don��t have Eclipse open at this point, open it up.
- Navigate through the menus to: Help -> Install New Software��
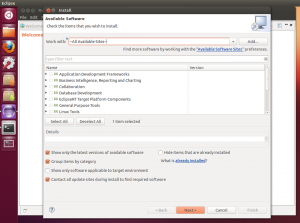
- You will be prompted with a new window asking you to select a site or enter the location of a site. You should be able to drop down the list of sites and find one labeled ���CAll Available Sites�C��. Select this option and wait for the list below to populate.
 class="alignnone size-medium wp-image-4829" title="ubuntu-12-10-eclipse-pdt-select-all-sites">
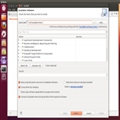
- Scroll through the list until you find a category labeled ��Programming Languages�� and click the arrow to expand this list.

- Continue to scroll through the Programming languages until you find a item labeled ��PHP Development Tools (PDT) SDK Feature�� and check the box to the left.

- Click Next and continue throw the installation. You��ll have to select that you agree to the terms of installing this software.
- After the installation has completed, you will be asked to restart Eclipse to apply changes. Go ahead and restart Eclipse, then move on to the next install.
?
Install XDebug
- Open a terminal and enter the following command to install Xdebug:
sudo apt-get install php5-xdebug?
- After installation completes, there are a couple of files that need to be configured. If you copy and paste the commands below, make sure to check that the quotes that are copied over are regular quotation characters, as they may cause problems if they are not.
-
sudo gedit /etc/php5/conf.d/*xdebug.ini?
zend_extension=/usr/lib/php5/20100525/xdebug.so
xdebug.remote_enable = 1
xdebug.remote_handler = ��dbgp��
xdebug.remote_host = ��localhost��
xdebug.remote_port = 9000?
-
sudo gedit /etc/php5/apache2/php.ini?
Scroll to the bottom and add:
zend_extension=/usr/lib/php5/20100525/xdebug.so
?
- Restart your Apache server so that the new PHP configuration settings are loaded.
sudo /etc/init.d/apache2 restart
?
- Confirm that your Xdebug installation was successfully loaded by creating a simple PHP file called ��phpinfo.php�� and placing it in the public root of your Apache web server. Be sure to include the following in your file, save it then navigate to it in your browser:
<?php phpinfo(); ?>
?
- After loading the php info page, search for ��xdebug��. If you find it listed, then you have successfully installed and configured Xdebug. If not, check back over the steps listed above or consult Google.
?
Configuring your Eclipse project to connect to Xdebug
After you��ve finally gotten everything installed, you��re probably anxious to start debugging. You��re not far off. The only thing that��s left is to import your PHP script or site and establish a Debug Configuration for your project.
To import a site, simple select: File -> New -> Project�� -> PHP -> PHP Project. This will open a new window where you can open PHP files from and existing location. Assuming this location is in your public root directory in Apache, you can work with these scripts in real-time.
After importing these existing files, right click on your new project and select: Debug As -> Debug Configurations��

Make sure that you��ve selected Xdebug as the Debugger type. Click Apply and then Debug. This will open a ��Debug�� perspective in Eclipse, allowing you to view variables and stack traces live. Assuming you��ve
created a
breakpoint or selected to break at the first line of the file, you should now see your PHP script paused waiting for you to debug!

?
Tip: If you��re planning to debug a large project such as a
WordPress, phpBB, vBulletin or any other large web application, pointing the Debug Configuration to your index.php makes debugging much easier.
?
Done
Congrats! By now you should be beginning a new road to a much easier life of PHP development.
If you have any questions, comments or suggests feel free to let me hear them below! I��ll try to help where I can, but I can?guarantee?I��ll know how to solve any of the issues you may encounter.