Recently I am trying to find a handy tool to measure the performance of my Java application and finally I think the VisualVM provided by JDK is the ideal one. This blog is written based on JDK1.7 + Eclipse 4.3.2.
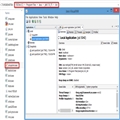
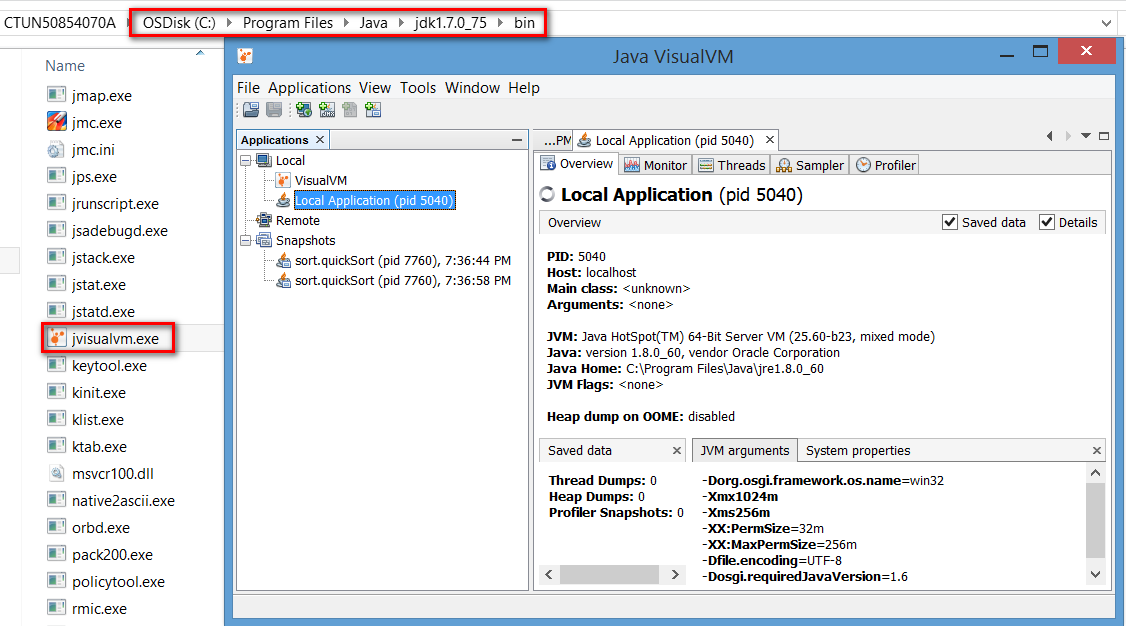
It is a tool automatically available after JDK is installed. The executable file could be found on your /bin as displayed below.
class="ztext-empty-paragraph">?
?
In order to measure the performance of your application, it is necessary for the application to be recognized by VisualVM first. There is a plugin named À¯VisualVM launcher for EclipseÀÝ which can help us about it.
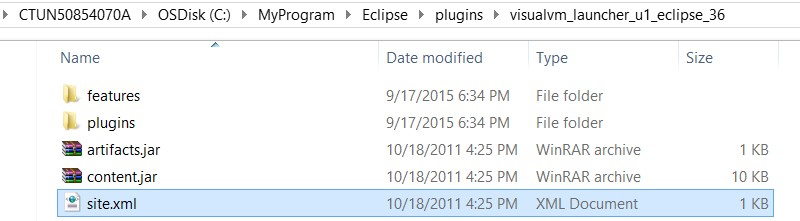
(1) download the zip from?http://visualvm.java.net/eclipse-launcher.html. Unzip the file and put it to the plugin folder of your Eclipse installation folder. In my laptop it looks like below. There should be a site.xml inside the unzipped folder.
?
?
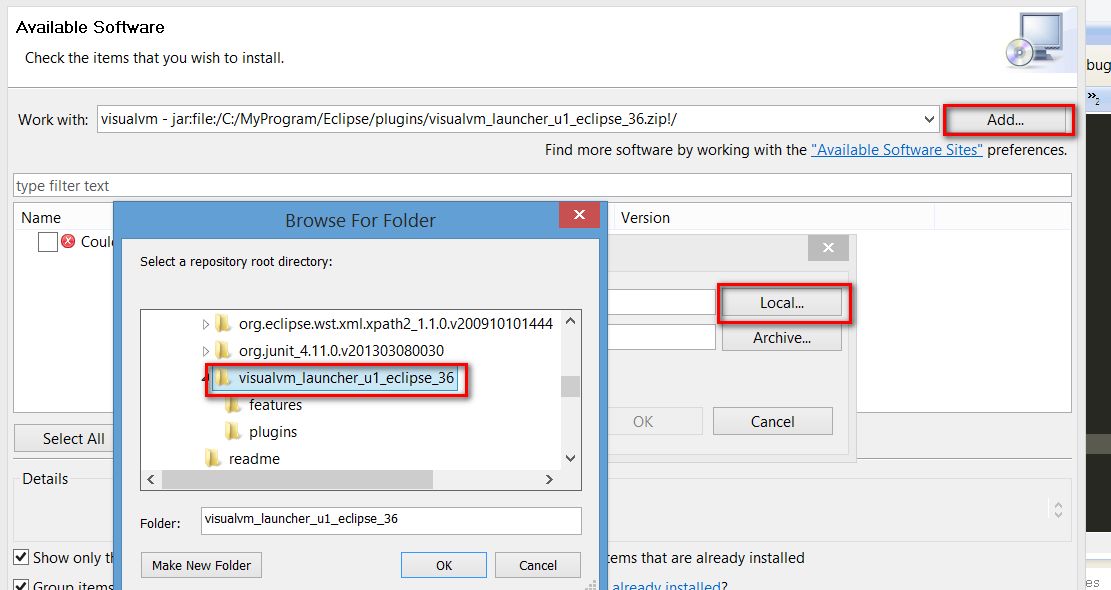
(2) In Eclipse, choose menu À¯Help->Install New SoftwareÀÝ, click À¯LocalÀÝ, add locate the folder to the one you finish in step1.
?
?
Then the local downloaded plugin is successfully parsed and ready for install.
?
?
finish the installation.
?
?
(3) Restart Eclipse, then you can find a new option via the path below. Configure two paths accordingly.
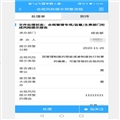
For À¯JDK HomeÀÝ, if you configure the JRE path by mistake, later when you try to measure your application, the VisualVM will fail to load with the following error message:
?
?
Now the plugin is ready to use.
(1) Select your Java project, choose context menu À¯Run asÀÝ->ÀÝRun configurationÀÝ, create a new Application configuration by specifying VisualVM launcher as its launcher, instead of the default Eclipse JDT launcher.
?
?
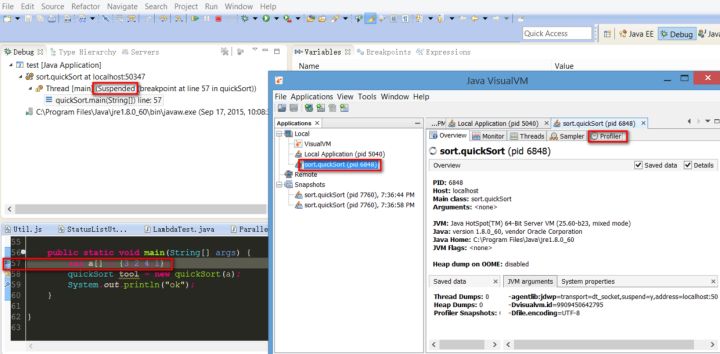
(2) For example I have a Java application which sorts an array by QuickSort algorithm written by myself and I would like to get its performance data, then I set a breakpoint on line 57, before my main logic is executed. Then launch the application in debugging mode with the application configuration created in previous step. Afterwards VisualVM will automatically be launched and successfully recognize the execution of my application. Click Profiler tab:
?
?
Current status: profiling inactive. Click CPU button:
?
?
Now profiling is activated:
?
?
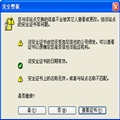
(3) Go back to Eclipse and click F8 to finish execution. Once finished, VisualVM will immediately capture this event and notify you. Just click Yes to get performance result.
?
?
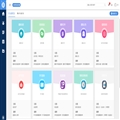
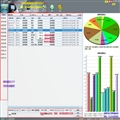
The result is displayed as below:
?
?
؈£þàÀ¡■ÑÁJerryçáåÙÇÇöáíôȘúŠ¿Ä濨øÖ¤é"ë¶æÆö¾":