        protected void SearchChart()
        {
            Chart1.ChartAreas.Clear();
            Chart1.Series.Clear();

                    ChartArea _ChartArea = null;
                    Series _SeriesJRATE = null;
                    Series _SeriesDRATE = null;
                    Series _SeriesDCL = null;

                    #region 循环添加 ChartArea
                    _ChartArea = new ChartArea();
                    //主X轴样式设置
                    _ChartArea.AxisX.MajorGrid.LineColor = System.Drawing.Color.FromArgb(224, 224, 224); //主X轴主网格线颜色
                    _ChartArea.AxisX.MajorGrid.LineDashStyle = ChartDashStyle.Dash;//主X轴主网格线虚线
                    _ChartArea.Position.Auto = true;
                    _ChartArea.Name = "ChartName";//设定ChartName
                    _ChartArea.AxisX.Title = "";//主X轴坐标标题
                    _ChartArea.AxisX.TitleAlignment = StringAlignment.Far;//主X轴坐标标题位置
                    _ChartArea.AxisX.Interval = 1;//间隔
                    _ChartArea.AxisX.IntervalType = DateTimeIntervalType.Number;//间隔类型指定
            //_ChartArea.AxisX.LabelStyle
                    //主Y轴样式设置
                    _ChartArea.AxisY.Title = "Commit";
                    _ChartArea.AxisY.TitleAlignment = StringAlignment.Far;
                    _ChartArea.AxisY.MajorGrid.LineColor = System.Drawing.Color.FromArgb(224, 224, 224);
                    _ChartArea.AxisY.MajorGrid.LineDashStyle = ChartDashStyle.Dash;
                    //副Y轴样式设置
                    _ChartArea.AxisY2.Title = "达成率";
                    _ChartArea.AxisY2.TitleAlignment = StringAlignment.Near;
                    _ChartArea.AxisY2.MajorGrid.LineColor = System.Drawing.Color.FromArgb(224, 224, 224);
                    _ChartArea.AxisY2.MajorGrid.LineDashStyle = ChartDashStyle.Dash;

                    //_ChartArea.AxisX.LabelStyle.Interval = 1; //X文本间隔
                    //_ChartArea.AxisX.LabelStyle.Font = new System.Drawing.Font("隶书", 12);
                    //_ChartArea.AxisX.MajorGrid.Interval = 1;  //X主要辅助线间隔
                    //_ChartArea.AxisX.MinorGrid.Interval = 1;//X次要辅助线间隔
                    //_ChartArea.AxisX.MinorTickMark.Interval = 1;//X次要刻度线间隔
                    //_ChartArea.AxisX.MajorTickMark.Interval = 1;//X主要刻度线间隔
                    //_ChartArea.AxisY.MinorGrid.Interval = 1;//Y次要辅助线间隔
                    //_ChartArea.AxisY.MajorGrid.Interval = 5;//Y主要辅助线间隔
                    //_ChartArea.AxisY.LabelStyle.Interval = 0.5;
                    Chart1.ChartAreas.Add(_ChartArea);

                    System.Drawing.Font F=new Font("宋体",16);
                    Title title = new Title("过程总体统计", Docking.Top,F,Color.Black);
                    Chart1.Titles.Add(title);
                    title.DockedToChartArea = _ChartArea.Name;
                    title.IsDockedInsideChartArea = false;
                    title.Alignment = ContentAlignment.TopCenter;

                    _SeriesJRATE = new Series();
                    _SeriesJRATE.ChartType = SeriesChartType.Column;
                    _SeriesJRATE.Name = "Commit";
                    _SeriesJRATE.ChartArea = _ChartArea.Name;
                    //_SeriesJRATE.BorderColor = System.Drawing.Color.Blue;
                    _SeriesJRATE.Color = Color.Blue;
                    _SeriesJRATE.BorderWidth = 1;
                    _SeriesJRATE.ShadowOffset = 1;
                    _SeriesJRATE.IsValueShownAsLabel = true;
                    _SeriesJRATE.MarkerStyle = MarkerStyle.Triangle;
                    _SeriesJRATE.LegendText = "Commit";
                    _SeriesJRATE.YAxisType = AxisType.Primary;//设为主Y轴
                    Chart1.Series.Add(_SeriesJRATE); //加入Series

                    _SeriesDRATE = new Series();
                    _SeriesDRATE.ChartType = SeriesChartType.Column;
                    _SeriesDRATE.Name = "AvgDate";
                    _SeriesDRATE.ChartArea = _ChartArea.Name;
                    //_SeriesDRATE.BorderColor = System.Drawing.Color.Green;
                    _SeriesDRATE.Color = Color.Green;
                    _SeriesDRATE.BorderWidth = 1;
                    _SeriesDRATE.ShadowOffset = 1;
                    _SeriesDRATE.IsValueShownAsLabel = true;
                    _SeriesDRATE.MarkerStyle = MarkerStyle.Square;
                    _SeriesDRATE.LegendText = "平均工作日";
                    _SeriesDRATE.XAxisType = AxisType.Primary;//设为主X轴
                    Chart1.Series.Add(_SeriesDRATE); //加入Series

                    _SeriesDCL = new Series();
                    _SeriesDCL.ChartType = SeriesChartType.Spline;
                    _SeriesDCL.Name = "Rate";
                    _SeriesDCL.ChartArea = _ChartArea.Name;
                    //_SeriesDRATE.BorderColor = System.Drawing.Color.Green;
                    _SeriesDCL.Color = Color.Yellow;
                    _SeriesDCL.BorderWidth = 1;
                    _SeriesDCL.ShadowOffset = 1;
                    _SeriesDCL.IsValueShownAsLabel = true;
                    _SeriesDCL.MarkerStyle = MarkerStyle.Square;
                    _SeriesDCL.LegendText = "达成率";
                    _SeriesDCL.YAxisType = AxisType.Secondary;//设为副Y轴
                    Chart1.Series.Add(_SeriesDCL); //加入Series
                    #endregion

                    Chart1.Legends[0].Docking = Docking.Top;
                    Chart1.Legends[0].DockedToChartArea = "ChartName";
                    Chart1.Legends[0].Alignment = StringAlignment.Center;
                    Chart1.Legends[0].IsDockedInsideChartArea = false;

                    //1 序号,'一月' 月份,15.00 Commit,9.69 平均工作日,92.98 达成率
                    DataTable dtChart = this.Getdt();
                    if (dtChart != null && dtChart.Rows.Count > 0)
                    {
                        for (int j = 0; j < dtChart.Rows.Count; j++)
                        {
                            string YF = dtChart.Rows[j]["月份"].ToString();
                            double dC = double.Parse(dtChart.Rows[j]["Commit"].ToString());
                            double dA = double.Parse(dtChart.Rows[j]["平均工作日"].ToString());
                            double dD = double.Parse(dtChart.Rows[j]["达成率"].ToString());

                            Chart1.Series["Commit"].Points.AddXY(YF, dC);
                            Chart1.Series["AvgDate"].Points.AddXY(YF, dA);
                            Chart1.Series["Rate"].Points.AddXY(YF, dD);
                        }
                    }
        }

        protected DataTable Getdt()
        {
            StringBuilder sb = new StringBuilder();
            sb.Append(@"select 1 序号,'一月' 月份,15.00 Commit,9.69 平均工作日,92.98 达成率 from dual
union
select 2 序号,'二月' 月份,15.00 Commit,11.69 平均工作日,86.62 达成率 from dual
union
select 3 序号,'三月' 月份,15.00 Commit,9.77 平均工作日,95.71 达成率 from dual
union
select 4 序号,'四月' 月份,15.00 Commit,10.53 平均工作日,90.06 达成率 from dual
union
select 5 序号,'五月' 月份,15.00 Commit,12.17 平均工作日,90.06 达成率 from dual
union
select 6 序号,'六月' 月份,15.00 Commit,10.14 平均工作日,100.00 达成率 from dual
union
select 7 序号,'七月' 月份,15.00 Commit,0.00 平均工作日,0.00 达成率 from dual
union
select 8 序号,'八月' 月份,15.00 Commit,0.00 平均工作日,0.00 达成率 from dual
union
select 9 序号,'九月' 月份,15.00 Commit,0.00 平均工作日,0.00 达成率 from dual
union
select 10 序号,'十月' 月份,15.00 Commit,0.00 平均工作日,0.00 达成率 from dual
union
select 11 序号,'十一月' 月份,15.00 Commit,0.00 平均工作日,0.00 达成率 from dual
union
select 12 序号,'十二月' 月份,15.00 Commit,0.00 平均工作日,0.00 达成率 from dual
union
select 13 序号,'平均值' 月份,15.00 Commit,9.14 平均工作日,93.85 达成率 from dual ");
            DataSet ds = OraHelper.GetDateDS(sb.ToString());

            if (ds != null && ds.Tables.Count > 0)
            {
                DataTable dtChart = ds.Tables[0];
                return dtChart;
            }
            else return null;
        }
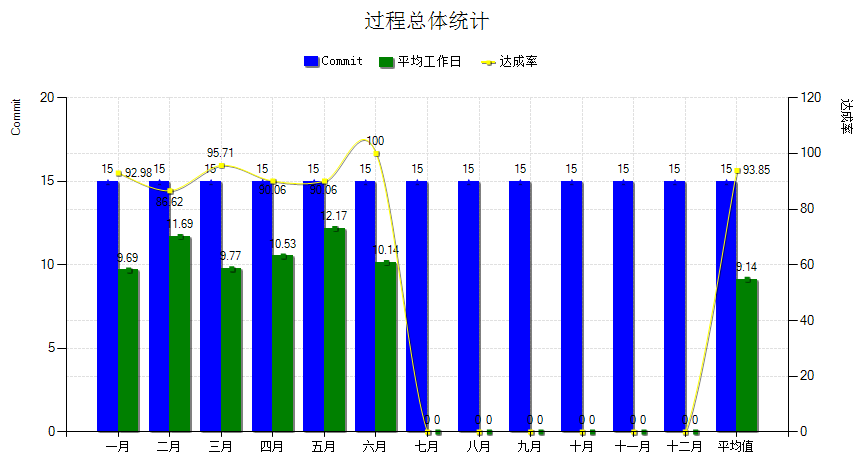
MSChart使用之双Y轴使用:效果如图: